|
|
World POPClock Projection
According to the International Programs Center, LinkU.S. Bureau of the Census,
the total population of the World,
projected to 2/5/01 at 21:04:57 GMT
(2/5/01 at 4:04:57 PM EST) is
|
Links |
|
Links |
|||
|
|
Chart on the World Population in 2000 |
|
|||
|
|
Chart on the World Population in 2001 |
|
|||
|
|
List of the Monthly World Population in 2001 |
|
|||
|
|
The Chart on the World Population from 1950 - 2050 shows that population will grow steadily to about 9 billion |
|
|||
|
|
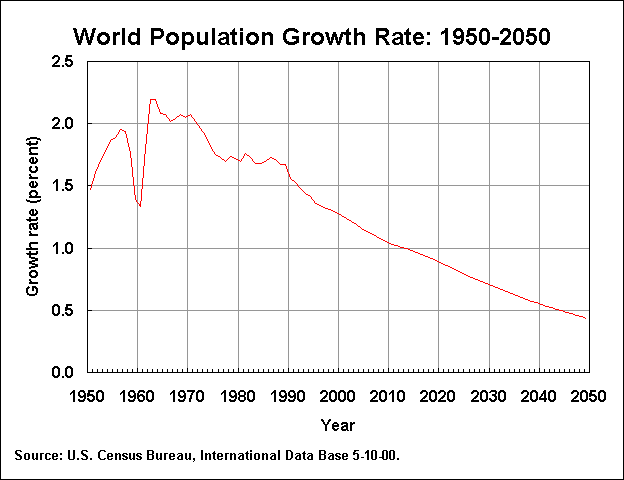
The Chart on the World Population Growth Rate from 1950 - 2050 shows that the growth rate is steadily decreasing |
|
|||
|
|
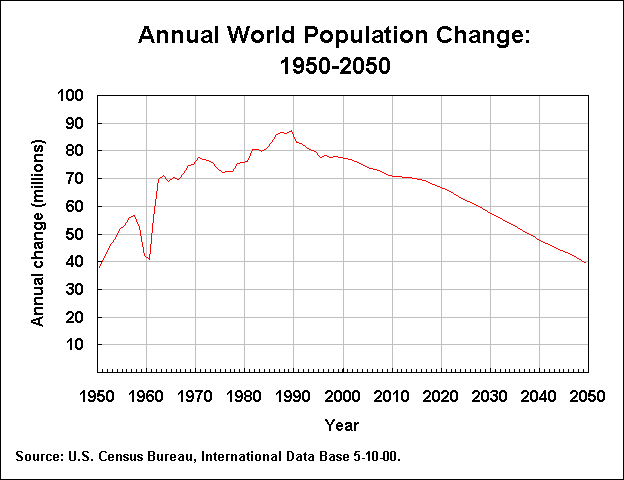
Chart on the % Change of World Population Growth shows that the growth rate is steadily decreasing |
|
|||
| Top 5 Nations comprise about half of the world's population |
|
||||
www.census.gov/cgi-bin/ipc/popclockw
Link
Note the number on the clock, then hit the "Reload" or "Refresh" button of your browser to see how many people have been added since you started to read this. |
World POPClock ProjectionAccording to the International Programs Center, LinkU.S. Bureau of the Census, the total population of the World, projected to 2/5/01 at 21:04:57 GMT (2/5/01 at 4:04:57 PM EST) is 6,126,682,946 |
Monthly World population figures07/01/00 6,080,141,68308/01/00 6,086,703,395 09/01/00 6,093,265,108 10/01/00 6,099,615,153 11/01/00 6,106,176,866 12/01/00 6,112,526,910 01/01/1 6,119,088,623 02/01/1 6,125,650,336 03/01/1 6,131,577,044 04/01/1 6,138,138,757 05/01/1 6,144,488,802 06/01/1 6,151,050,515 07/01/1 6,157,400,560 |
|
 |
 |
The End